

Reading time
12 mins
Last updated
Nov 14, 2025
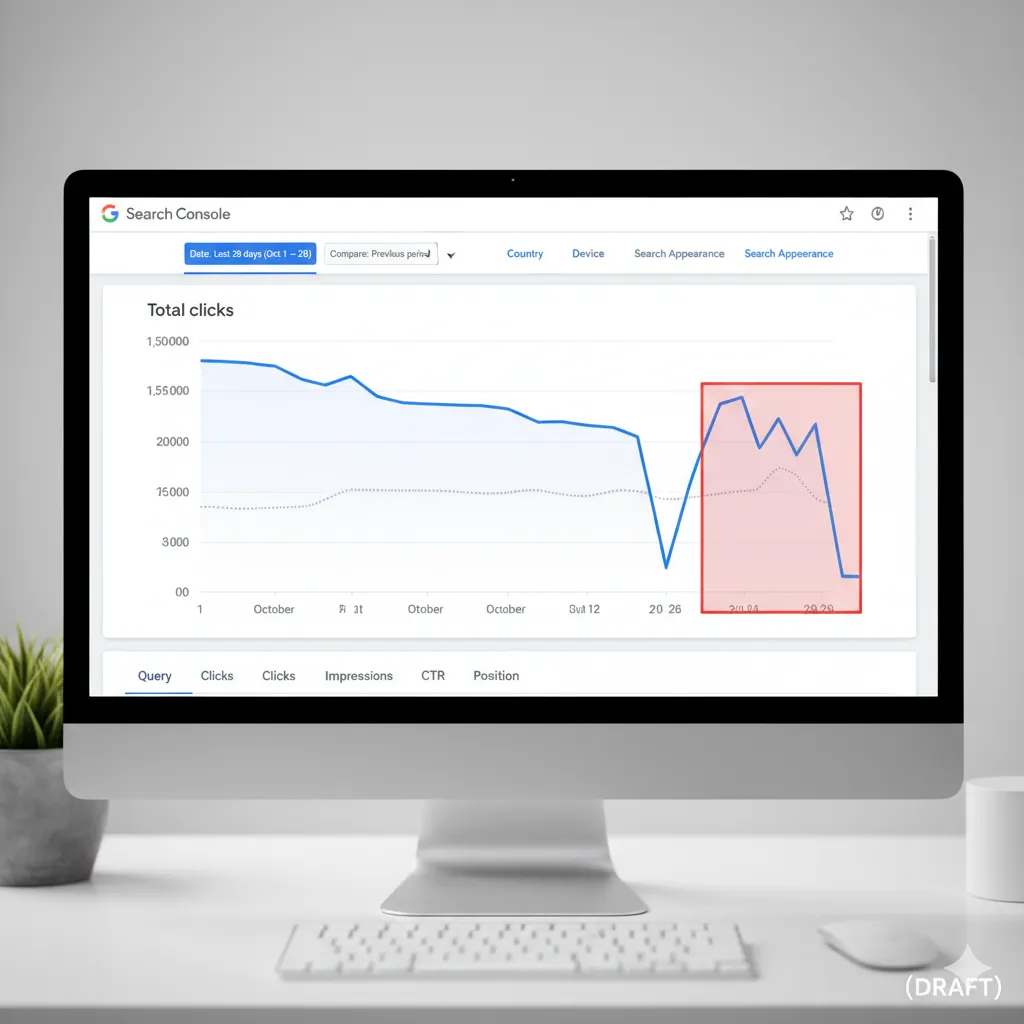
You’re reviewing your Google Search Console data, feeling confident about your SEO progress. Traffic’s been climbing, impressions are growing, and then BAM. Around September 8th, you see this massive impression drop that makes your stomach sink.
At Opascope, we’ve analyzed this pattern across our entire client portfolio, and the sites with the most dramatic “impression drops” are often the ones with the most stable click growth. That tells you everything you need to know about which metric actually matters.
But here’s where it gets interesting. You click over to average position, and something doesn’t add up. Your rankings actually improved significantly. How can your positions get dramatically better while your impression share drops off a cliff?
If you’re managing just one website, that might be alarming. But if you’ve got a portfolio of clients like we do at Opascope, you’ve probably noticed something: this is happening to virtually every single site.
So what’s really going on here? The answer involves a technical change from Google that’s created one of the bigger SEO measurement disruptions in years, but it’s actually making your data more accurate, not less.
What follows are the steps we took to optimize Linode’s funnel and, as a result, increase the company’s monthly paid signups by 660%.
But first, let’s explain why the problems Linode experienced are so common for SaaS companies using a product-led growth (PLG) model.
The Technical Explanation: Google Killed the &num=100 Parameter
Right around September 8th, Google made a change that removed your ability to see 100 search results per page.
There used to be a parameter you could add, &num=100, so that when you did a Google search, instead of showing the typical 10 listings, you could see 100. Browser extensions used this feature. SEO professionals tracking rankings used it to scan deeper than a single page, without clicking through 10 pages of results.
But here’s the kicker: SEO tools like SEMrush and Ahrefs were likely using this parameter extensively. AI tools like ChatGPT and Perplexity likely did the same, scanning search results with &num=100 to gather information and decide which pages to cite.
Google looked at this situation and decided to remove that parameter entirely.
This isn’t speculation. The change has been covered extensively in Search Engine Land and Search Engine Journal, with clear documentation of how it’s creating ripple effects throughout the SEO industry.
“Many are also noticing that the data in Google Search Console’s performance reports also seems off.”
“Multiple SEO professionals saw sharp declines in desktop impressions in Google Search Console starting September 10, with average position increasing accordingly.”
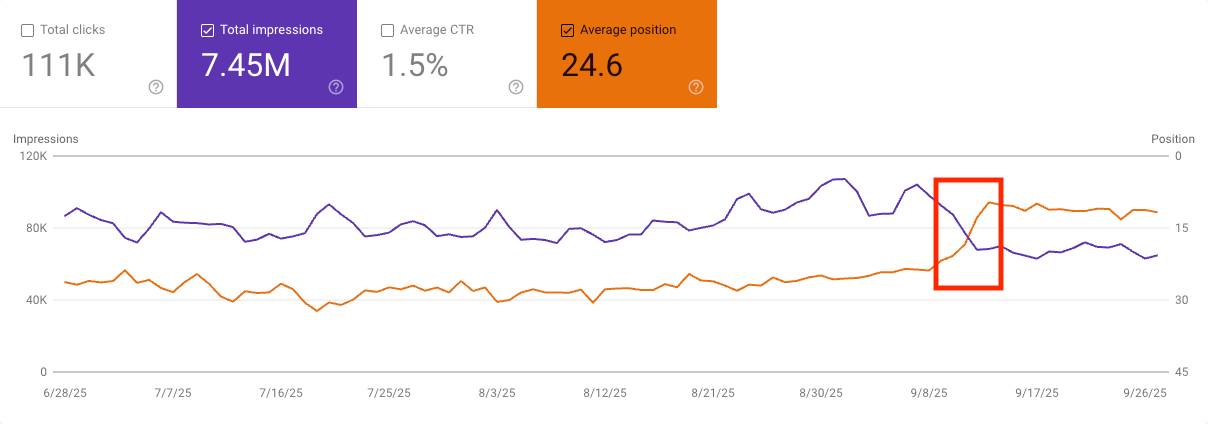
This tell-tale x-pattern you’re seeing (impressions down, average position up) is the direct result of this technical infrastructure change.
Why Impressions Dropped But Clicks Stayed Stable
Here’s where the story gets really interesting, and where you can stop worrying about your SEO performance.
Let’s look at what actually matters: total clicks. When you examine the click data for sites experiencing this impression drop, you’ll see that results are actually going up despite impressions going down significantly. The change has not made much of a difference to total clicks across the board.
You’ll see this pattern time and time again when you dig into the data. This average position improvement and impression drop combination is actually not something to worry about.
Why? Because the people who are actually clicking (the people who are actually taking actions on your website, converting, and doing the things that matter to your bottom line) weren’t those browsing search results in positions 80 or 90 to give you ranking data.
When those deep-position impressions disappeared from bot scraping, that’s exactly why you’re seeing a jump in average position. You’re no longer getting artificial inflation from those lower positions showing up in your data.
Even Google’s John Mueller weighed in with some levity, posting: “Maybe the real impressions were the friends we made along the way.”
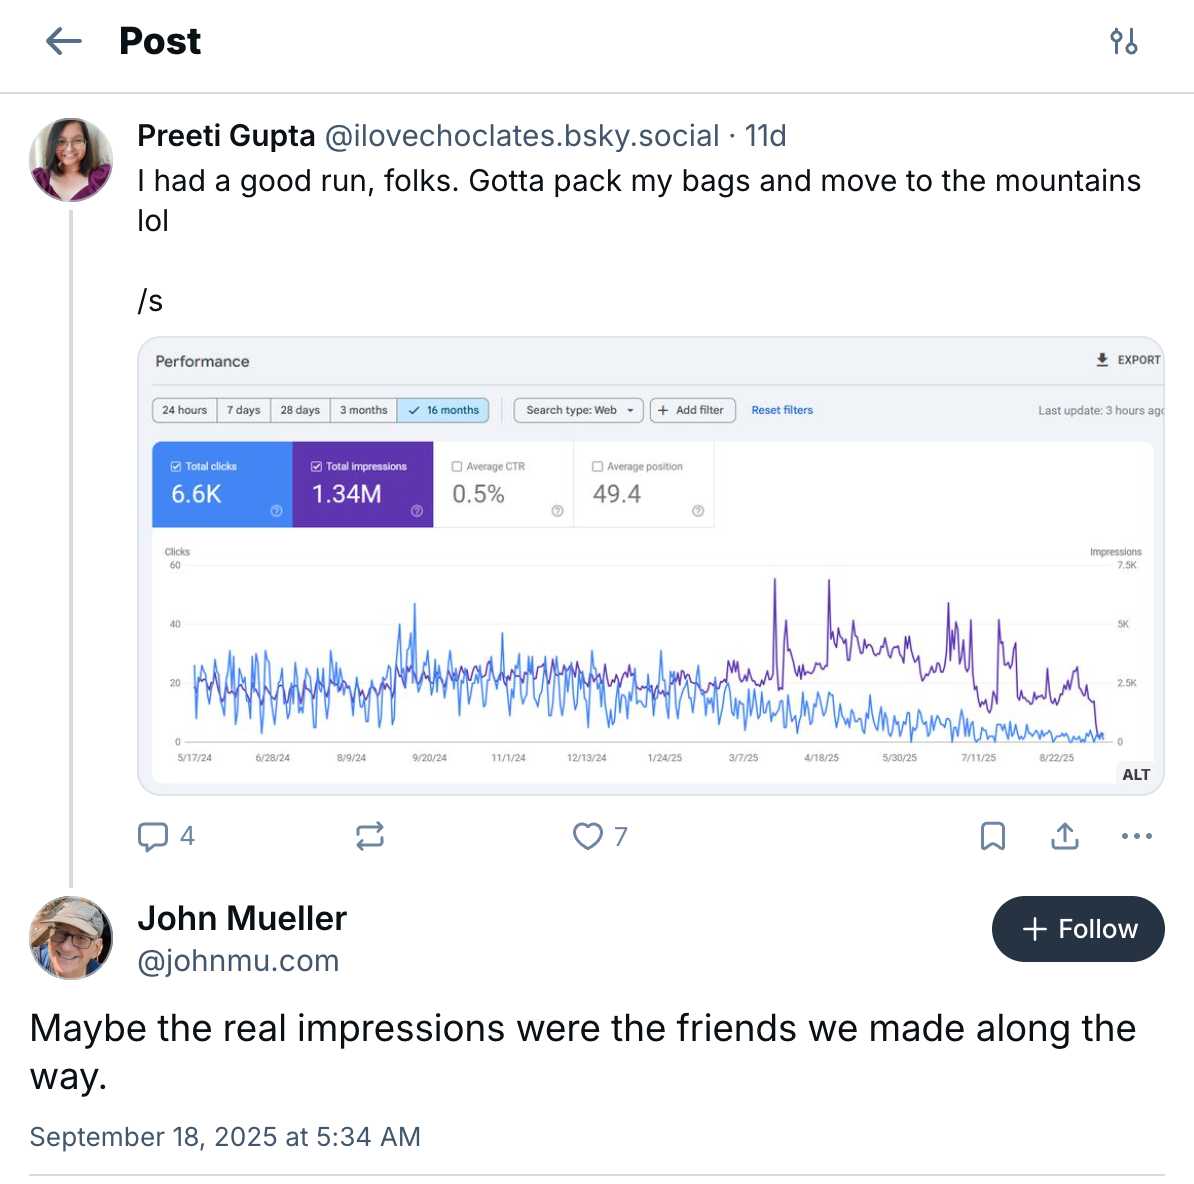
That’s actually profound when you think about it. The real impressions (your actual friends in this analogy) are the ones converting into clicks. They’re the ones continuing to engage with your content. It’s not the bots scraping position 90 that were inflating your impression counts.
The data that mattered for your business was never coming from those artificially inflated impression numbers anyway.
The Smart Way to Use GSC During This Transition
If you want to see actual ranking performance that hasn’t been affected by this change, here’s the key: drill down to specific queries and specific pages.
The way to do this is by first selecting the search term that you want to track and then finding that in the query tab in Google Search Console. Then go to the actual page that is ranking the highest for that keyword. By combining this query search as well as the page filter, what it is doing is filtering out some of the long tail traffic and other noise that was being affected by the N=100 search.
This granular approach (looking at specific searches and specific pages) lets you see historically where you’re actually ranking and how performance is trending for individual pieces of content.
How to Track SEO Performance Moving Forward
The way to analyze your SEO performance now is through very specific searches in Google Search Console, Google Analytics traffic data, and most importantly, clicks.
Clicks are the metric unaffected by this change. They represent real user behavior and actual business impact. This is how you want to manage and evaluate your SEO performance going forward.
Here’s your new measurement framework:
Primary metric: Total clicks
Clicks remain your most reliable GSC metric because they represent actual user acquisition. This data was never inflated by bot activity, so you can trust it completely. Use total clicks as your north star metric for organic search performance.
Secondary validation: Google Analytics organic traffic
Cross-reference your GSC click data with Google Analytics organic sessions. If both sources show stable or growing traffic, you can confidently ignore impression fluctuations. GA4 provides the business context (conversions, revenue, engagement) that GSC can’t, making it your second line of defense against misleading data.
Granular analysis: Query-specific and page-specific GSC data
Here’s where GSC still provides valuable impression and position data, but you need to filter aggressively to cut through the noise.
How to do this effectively:
- Focus on high-value keywords only. Identify your 20-50 most important queries (those that drive actual conversions, not just traffic) and analyze them individually.
- Filter by exact page. Don’t look at site-wide averages. Instead, go to a specific landing page and see which queries drive traffic to that page specifically.
- Remove long-tail noise. The bot-driven impressions primarily affected obscure, low-volume keywords. By focusing on your core terms, you eliminate the extraneous data that’s making aggregate reports unreliable.
- Track trends, not absolutes. For each high-value query/page combination, monitor whether position and impressions are moving up or down week-over-week after September 8th.
This granular approach removes the statistical noise from aggregated data and gets you to the true traffic-driving performance. When you drill down to “keyword X on page Y,” you’re looking at real user behavior, not bot-generated impressions from position 87.
Business Impact: Conversion and Revenue Data
Track the metrics that actually matter to your bottom line. At the end of the day, SEO exists to drive business results, not to improve vanity metrics in a dashboard.
What to measure:
- Organic conversions: How many leads, sales, or sign-ups came from organic search? This number should remain stable or grow regardless of GSC impression fluctuations.
- Revenue per organic session: If you’re in e-commerce or have revenue tracking set up, this tells you whether your organic traffic is becoming more or less valuable over time.
- Goal completion rate: Are organic visitors completing the actions you want them to take? A stable completion rate means your SEO is attracting the right people.
- Engagement metrics: Time on page, pages per session, and bounce rate from organic traffic indicate whether you’re matching user intent, which is what Google actually cares about.
Why this matters now: If your GSC impressions dropped 40% but your organic conversions stayed flat or increased, you have definitive proof that the “lost” impressions were never connected to real business value. They were statistical noise. Your actual SEO performance is fine.
This is the data you should be reporting to stakeholders, not impression counts that were artificially inflated by bots scraping position 90. When someone asks “how’s our SEO doing?”, the answer should reference conversion trends and revenue impact, not GSC graphs that require a 10-minute explanation about the &num=100 parameter.
Timeline expectations: You’re looking at a couple of months to figure out a reliable new baseline for impression data. After that, you’ll need another 12 months to get meaningful year-over-year comparison data back.
During this adjustment period, resist the urge to make dramatic changes to your SEO strategy based on impression fluctuations. The fundamentals of good SEO haven’t changed; you’re just getting cleaner measurement data now.
Third-Party Tool Implications
Tools like SEMrush that probably used &num=100 extensively will need to make adjustments. We’ve seen this before when SEMrush updated their database and added new keywords, causing temporary jumps and fluctuations in reporting.
You’re going to need to ride out this new baseline period with your position tracking tools.
Here’s what’s happening technically: Tools that could previously retrieve 100 search results with a single query now need to hit Google 10 different times to get the same data. This may make data collection:
- Slower (more API calls required)
- More expensive (10x the server resources)
- Potentially less frequent (due to cost constraints)
Most tools have always been about a month and have always been about a month behind in their data due to the time it takes to make all their queries. We’ll see how various tools react to this new reality over the coming months.
The good news: Position tracking reports that ping your exact keywords and track specific rankings should be less affected than broad organic search reports. These tools are actually going out and checking your specific terms, so their core functionality should remain intact.
We’ll keep monitoring how the major SEO tools adapt, but expect some temporary inconsistencies and potential gaps in deep-ranking data.
The Bottom Line: This Is Measurement Evolution, Not SEO Crisis
This Google Search Console impression drop represents a measurement correction, not a traffic problem.
Google has cleaned up their data by removing artificial bot-generated impressions that were never connected to real user behavior. Your “drop” in impressions likely represents the removal of data points that were never driving actual business results.
What you should track moving forward:
- Clicks (your most reliable GSC metric)
- Google Analytics organic traffic (validates your GSC data)
- Query and page-specific performance (for detailed insights)
- Conversion and revenue metrics (actual business impact)
What you should ignore:
- Site-wide impression comparisons to pre-September data
- Average position improvements that seem “too good to be true”
- Panic-inducing impression graphs without context
The SEO fundamentals remain unchanged. Create valuable content, optimize for user intent, maintain technical health, and build authority. The difference is you now have cleaner, more accurate data to measure what’s actually working.
The adjustment period will take time, but you’ll come out with more reliable data and a clearer picture of your real SEO performance. In an industry often clouded by vanity metrics, that’s actually a significant improvement.
Frequently Asked Questions
Q: Did my website get penalized by Google in September 2025?
No. If your impressions dropped but your clicks remained stable (or even increased), this is a data reporting change, not a penalty. Google penalties affect actual traffic, not just how impressions are counted. Check your Google Analytics; if organic traffic is steady, your site is fine.
Q: Should I change my SEO strategy because of the GSC data shift?
Not based on impression drops alone. The fundamentals of good SEO haven’t changed. Focus on what matters: clicks, conversions, and actual traffic from Google Analytics. If those metrics are stable or growing, keep doing what you’re doing.
Q: How long until my Google Search Console data is reliable again?
You can trust click data right now; it was never affected. It is actually MORE RELIABLE now. For impressions, you’ll need 2-3 months to see a stable new baseline, and about 12 months before you can make meaningful year-over-year comparisons. Use September 8th, 2025 as your reset point.
Q: Are third-party rank tracking tools still accurate?
Top 10-20 rankings should still be reliable, but deeper position tracking (beyond page 2) may have gaps or delays as tools adapt. Focus on tracking your most important keywords and use Google Analytics to validate that actual traffic aligns with your ranking data.
Need help interpreting your Google Search Console data during this transition period? Our technical SEO team has been analyzing this industry-wide change across hundreds of client accounts. Get in touch to discuss how these measurement changes affect your specific SEO strategy.