


Reading time
23 mins
Last updated
Oct 22, 2026
A buyer asks an AI assistant: “It’s between X and Y. Which one should I choose?” We expected the answer to depend on the brands. It also depends on which brand the buyer types first. In a paired experiment with gpt-5.6-luna and live web search, strong favorites won in either order. But when the model saw two brands as evenly matched, the brand named first won 63.3% of comparisons, nearly two out of three.
That matters in two places. For measurement, any generative engine optimization (GEO) tool that tests head-to-head prompts in only one order is partly measuring the order of the names, not the strength of the brand. For marketing, if buyers tend to type the brand that comes to mind first, brand awareness feeds directly into which brand the AI recommends.
- 4,608 votes in 2,304 vote pairs, each prompt asked in both orders
- 21 brand sets, 97 categories, 482 matchups, in English and German
- 54.7% of all votes went to the first-named brand (50% expected with no order effect)
- 2.98x higher odds of winning when a brand is named first
- 63.3% win rate for the first-named brand when the model has no preference between the two
This article summarizes the whitepaper First come, first recommended? Position bias in head-to-head brand recommendations by a frontier AI model (v1.0, October 2026) by Eike Henrich (independent), Jimmy Park (Opascope) and Tobias Peschke (Loud & Lexis). The full paper is published by Loud & Lexis.
Why head-to-head prompts are a measurement problem
Head-to-head prompts such as “It’s between X and Y; which one should I choose?” show up late in a purchase decision, when the buyer has already narrowed the list. That makes them one of the standard ways to measure brand visibility in AI search. If the order of the names changes the answer, then a measurement taken in one order mixes up two things: how much the model prefers the brand, and where the brand sat in the prompt.
Position bias, the tendency to favor an option because of where it appears, is already well documented in three settings:
- Language models judging other models’ answers. GPT-4 kept its verdict in only 65.0% of swapped pairs (Zheng et al., 2023). Swapping the order changed ChatGPT’s verdict on 66 of 80 questions (Wang et al., 2024). Across 15 judges, verdicts flipped most often when the candidates were similar in quality (Shi et al., 2025).
- Lists of options. Order shifts answers to multiple-choice and classification prompts (Pezeshkpour and Hruschka, 2024; Zheng et al., 2024; Wang et al., 2023) and the rankings of LLM recommenders (Hou et al., 2024; Bito et al., 2025). In similarity judgments, GPT-4 chose the first of two options in 63% of responses, and telling it the order was randomized did not help (Brucks and Toubia, 2025).
- Shopping decisions. Some models favor the first of two product descriptions (Laurito et al., 2025), and AI shopping agents favor certain positions in a mock storefront (Allouah et al., 2025). People show comparable primacy effects (Miller and Krosnick, 1998; Mantonakis et al., 2009).
The closest prior design, Allouah et al. (2025), randomized the positions of real products in a mock storefront, but its agents chose among eight listings inside a sandbox without web search. We are not aware of a study that tests a choice between two named real brands, in a user-style question, asked in both orders with repeated sampling, on a frontier model with live web search. That is the gap this study fills.
How the experiment worked
Brand sets and prompts. The sample covers 21 brand sets, most from Loud & Lexis or Opascope client projects; one is Loud & Lexis itself. Each set has a focus brand and, per product category, up to five competitors that gpt-5.6-luna identified from answers to competitor questions. The same model wrote a persona and a need for each category. That yields 97 categories, 482 matchups and 305 distinct brand pairs. Every prompt followed one template (see the appendix below): the persona states the need, names both brands, and asks for a one-sentence verdict followed by four structured sections. The second order swaps the two brand names in both places they appear. Brand sets from German-speaking markets were prompted in German (7), the rest in English (14).
| Term | Meaning |
|---|---|
| A, B | The brand named first and the brand named second in a prompt. |
| Vote | One answer with a verdict for one of the two brands. |
| Vote pair | The same prompt in both orders (two independent calls); each brand is A once. |
| Matchup | All vote pairs of the focus brand and one competitor in one category; usually 5 vote pairs, i.e., 10 votes (92% of matchups). |
Data collection and labeling. We collected 4,928 answers in complete vote pairs from gpt-5.6-luna through the OpenAI Responses API, with web search enabled and default settings, between 2026-10-08 and 2026-10-16. Every answer was an independent call, and each matchup’s prompt was asked five times in each order (once per order for a few categories). A reading model (gpt-5.6-luna; gpt-4o-mini for 7 brand sets) read each verdict and returned the chosen brand or “none”, counting qualified choices such as “leaning toward X”. A blind re-check of 100 random votes per reading model, using Claude Opus 5.5, agreed in 199 of 200 cases. One brand set (300 answers) was excluded because its generated personas were too vague for the model to decide. After removing the 10 vote pairs in which either answer had no verdict, 4,608 votes in 2,304 vote pairs remained.
Statistical analysis. Because every pair is tested in both orders, true brand strength cancels out: with no position effect, the first-named brand should win half of all votes. We tested the share of votes won by A with an exact binomial test (Clopper and Pearson intervals), changed vote pairs with an exact McNemar test, and matchup majorities with sign tests.
To size the effect independently of brand strength, we fitted a Bradley and Terry model with an order term, as a conditional logistic regression with matchups as strata:
logit P(brand i wins) = αmatchup + β [i = A]
α captures how strong the two brands in a matchup are; β is the extra pull of being named first. The odds ratio eβ is the factor by which naming a brand first multiplies its odds of winning; 1 would mean no position effect. For two brands the model rates as equal, the first-named brand then wins with probability logit−1(β/2). Mantel and Haenszel and vote-pair estimates serve as cross-checks. Because the effect may differ between brand sets, we also report an interval from a cluster bootstrap that resamples whole brand sets (5,000 replicates). The same bootstrap, resampling German and English sets separately, gives the interval for the ratio of the German and English odds ratios.
Whether the effect differs between brand sets was tested with a likelihood-ratio statistic comparing one odds ratio per brand set against a common odds ratio, with a permutation test that shuffles brand-set labels across matchups (2,000 draws). Differences by matchup closeness were tested with a likelihood-ratio test, and differences across repetitions and collection days with χ² tests of the share won by A. All tests are two-sided.
The first-named brand wins more often
The first-named brand won 54.7% of all votes, more than the 50% expected without a position effect. In most comparisons, order did not change the winner: in 79.5% of vote pairs, the same brand won in both orders. In the remaining 20.5%, the winner changed with the order, and in 72.9% of those cases it was the brand named first.

Figure 1. Outcomes of the 2,304 vote pairs (same prompt in both orders). “First-named won both”: the winner changed with the order and was the first-named brand both times.
Part of this is ordinary run-to-run variation. Across all combinations of two votes within a matchup, not only the matched vote pairs, votes asked in the same order named different winners in 15.6% of cases, and votes asked in opposite orders in 20.0%. The gap between those two numbers is the order effect.
How big the order effect is
Being named first multiplied a brand’s odds of winning by 2.98. For two brands the model rates as equal, that turns a 50 : 50 split into 63.3% vs 36.7%. The first-named brand wins nearly two-thirds of the time. The cross-checks and the brand-set bootstrap all point the same way.
| Level | Measure | Estimate | 95% CI | p | Test |
|---|---|---|---|---|---|
| Votes (4,608) | Won by A | 54.7% | 53.2%–56.1% | 2.1 × 10⁻¹⁰ | binomial |
| Vote pairs (2,304) | Same brand won in both orders | 1,832 | |||
| Winner changed: A won both | 344 | ||||
| Winner changed: B won both | 128 | ||||
| Share of changes won by A | 72.9% | 68.6%–76.8% | 6.8 × 10⁻²⁴ | McNemar | |
| Matchups (482) | One brand won every vote | 254 | |||
| Majority of votes to A / to B | 151 / 51 | 1.1 × 10⁻¹² | sign test | ||
| Majority winner changed with the order (to A / to B) | 62 / 15 | 6.1 × 10⁻⁸ | sign test | ||
| Effect size | Odds ratio A vs B, conditional logit | 2.98 | 2.42–3.66 | 6.4 × 10⁻²⁵ | Wald |
| Odds ratio, brand-set bootstrap | 2.12–4.42 | ||||
| Odds ratio, Mantel and Haenszel | 2.76 | 2.26–3.38 | cross-check | ||
| Odds ratio, vote pairs (344/128) | 2.69 | 2.19–3.32 | cross-check | ||
| P(A wins), no brand preference | 63.3% | 60.9%–65.7% | model |
Table 1. Position effect at vote, vote-pair and matchup level. Exact tests unless stated otherwise; the bootstrap interval resamples brand sets.
Close matchups are where order decides the winner
Order made no difference in the 230 of 445 ten-vote matchups where the same brand won all ten. In close matchups (6 : 4 or 5 : 5 overall), the first-named brand won 63.4% of votes.
The odds advantage of being named first is no larger in close matchups; its effect on win shares is. Odds ratios fitted separately by closeness show no significant difference (p = 0.23), and the shares predicted from the single odds ratio match the observed ones (Figure 2). In plain terms: the same push applies everywhere, but it only flips the outcome when the two brands are near even. Studies of LLM judges report the same pattern (Zheng et al., 2023; Wang et al., 2024; Shi et al., 2025).
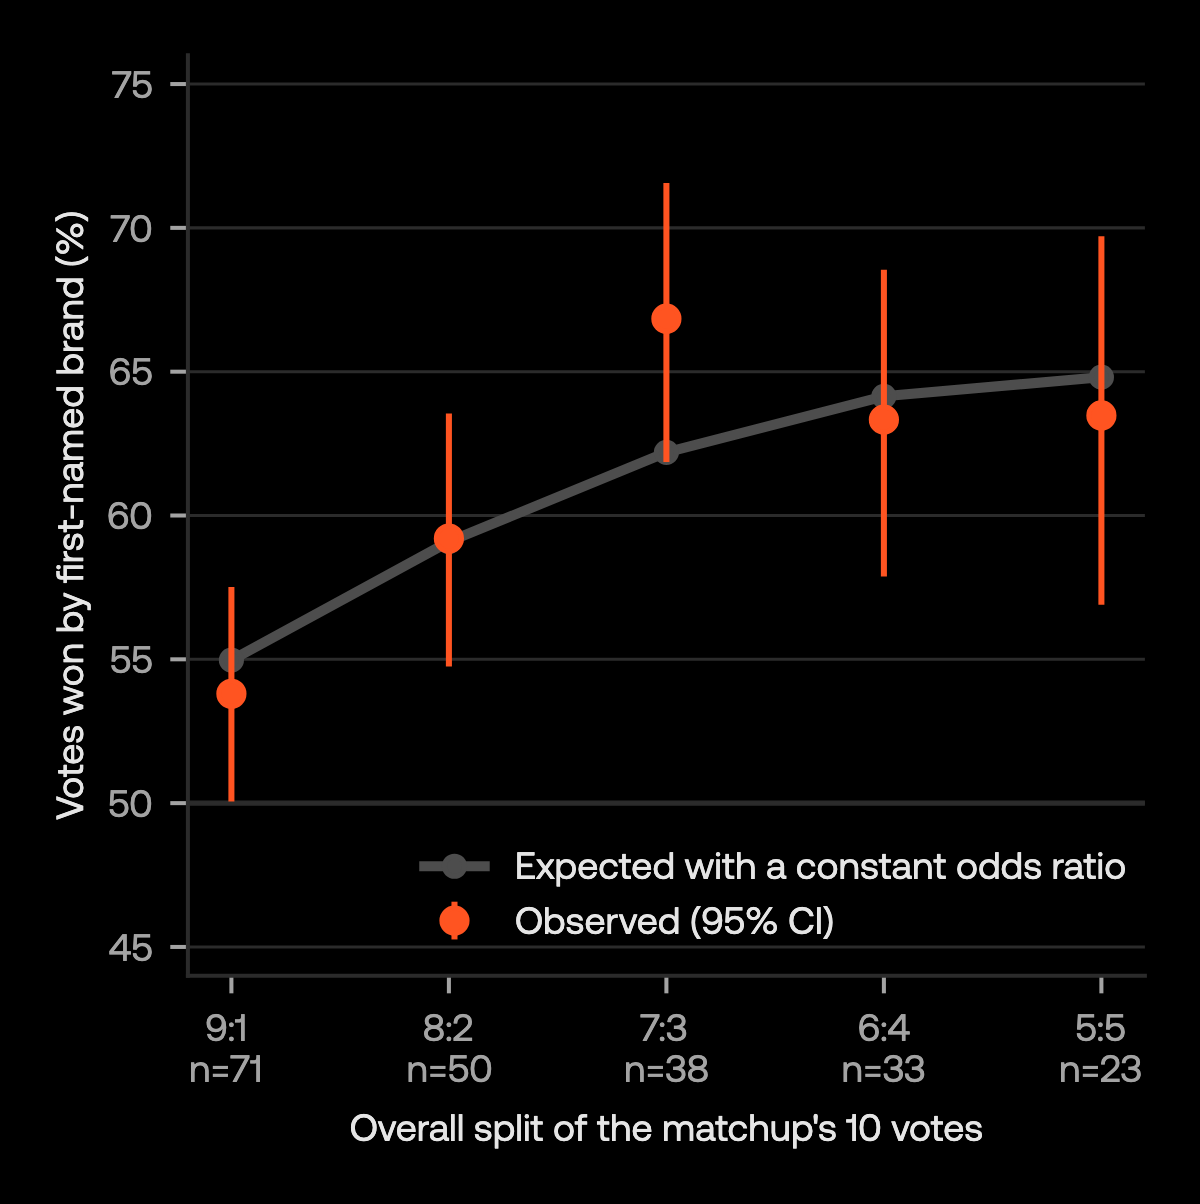
Figure 2. Votes won by the first-named brand by overall split of the matchup (215 matchups with 10 votes in which neither brand won every vote; 95% CIs). Gray: prediction from a constant odds ratio of 2.98.
The effect held in 18 of 21 brand sets
The first-named brand won the majority of changed vote pairs in 18 of the 21 brand sets (Figure 3). None of the other three shows a significant reverse effect (0 : 2, 17 : 18, 11 : 11; all confidence intervals include 50%). The strength of the effect varied significantly between brand sets, from none to strong (permutation test, p = 0.002). The overall odds ratio of 2.98 is an average across sets, not the effect to expect for any single brand.
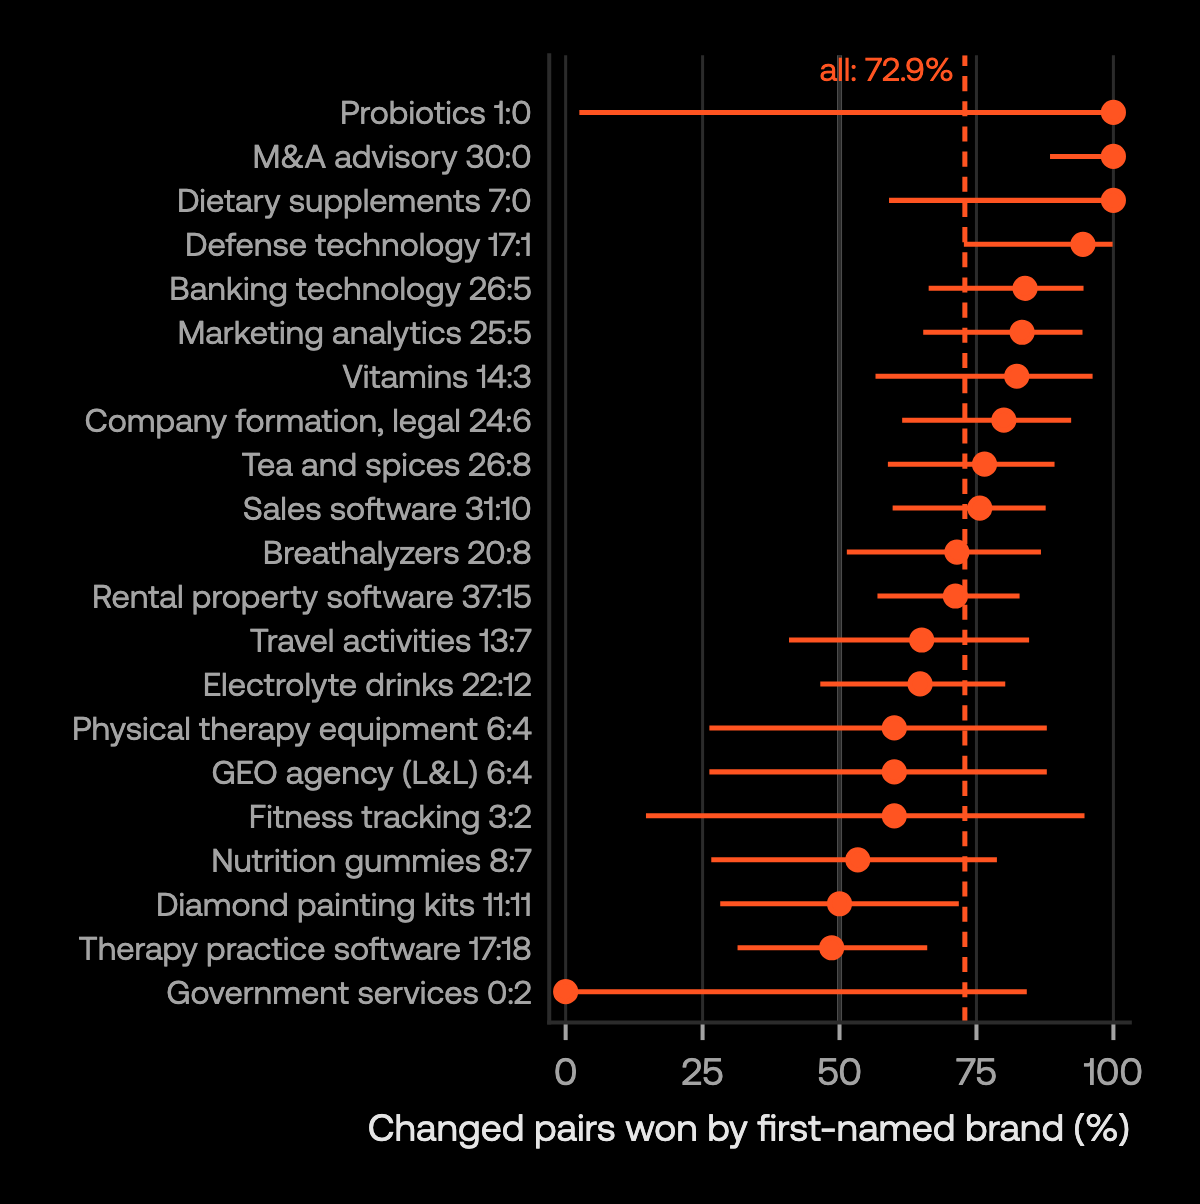
Figure 3. Vote pairs with a changed winner that were won by the first-named brand, per brand set (A : B; 95% CIs). Dashed line: all brand sets.
The effect looked larger for German prompts than for English ones (odds ratio 4.39 vs 2.30). Once variation between brand sets is accounted for, that difference is uncertain: the bootstrap interval for the ratio of the two odds ratios (0.98 to 4.00) includes 1. Language is also confounded with industry, so we treat the language difference as exploratory.
The odds ratio barely moves when the Loud & Lexis brand set is left out (3.02) or the excluded set is added back (3.09), and the effect did not vary significantly across repetitions or collection days (see the robustness table in the appendix).
What this means for GEO measurement
Pooling both orders, as this study did, cancels out the position effect. A measurement taken in only one order has no such protection. On average, it shifts a brand’s win rate by 4.7 percentage points.
The focus brands in this study show the gap clearly: they won 62.8% of their comparisons when named first and 53.4% when named second. In 16% of matchups (about one in six), the two orders named different majority winners, mostly in favor of the first-named brand (62 vs 15). If your AI visibility report runs “Brand vs Competitor” in one order only, roughly one in six of its head-to-head calls could flip with the order.
The remedy is already established: ask in both orders (Wang et al., 2024; Brucks and Toubia, 2025) and count a win only if it holds in both (Zheng et al., 2023).
Instructions to ignore the order are not a practical fix. Buyers do not give them, and such instructions did not prevent position bias in LLM judges (Zheng et al., 2023) or shopping agents (Allouah et al., 2025), nor did telling a model that the order was randomized (Brucks and Toubia, 2025).
Why brand awareness may decide who gets named first
In real use, the buyer decides which brand comes first. Our hypothesis: buyers tend to name first the brand that comes to mind first, meaning the brand with higher top-of-mind awareness (Aaker, 1996; Keller, 1993), or the one they already lean toward.
If that holds, the position effect turns brand awareness into an advantage inside AI answers. In close comparisons, the better-known brand would more often be named first, and therefore more often be recommended. That would stack on top of a direct advantage already observed: with identical specifications, well-known brands won every recommendation in one study (Chu and Hou, 2026). Query logs or buyer surveys could test the naming-order link directly.
The practical read for marketers: brand building outside AI search likely shapes AI recommendations too. Awareness is not just a top-of-funnel metric when the buyer’s own phrasing becomes the model’s tiebreaker.
Limitations
- Other models may show weaker, stronger or reversed effects (Zheng et al., 2023; Wang et al., 2024; Allouah et al., 2025).
- The design measures the final answer and cannot separate effects of web retrieval from generation.
- The brand sets come mostly from client projects and are not a representative sample of the market.
- How buyers order brand names was not measured.
Three rules for testing head-to-head prompts
Position bias affects the brand recommendations of a frontier model with web search. Brands the model clearly prefers win regardless of order. In close comparisons, the first-named brand is favored: when the model has no preference between two brands, the first-named one wins 63.3% of comparisons. For GEO practitioners, three rules follow:
If buyers name the better-known brand first, as hypothesized above, brand building outside AI search also shapes AI recommendations.
Frequently asked questions
These are the questions we hear most when we walk teams through this study.
What is position bias in AI brand recommendations?
Position bias is the tendency of an AI model to favor an option because of where it appears in the prompt. In this study, when a buyer asked gpt-5.6-luna with web search to choose between two evenly matched brands, the brand named first won 63.3% of comparisons instead of the 50% expected without an order effect.
Does the order of brand names change what ChatGPT recommends?
Sometimes. In 79.5% of vote pairs the same brand won in both orders, so clear favorites win regardless. In the other 20.5% the winner changed with the order, and the first-named brand took 72.9% of those. Being named first multiplied a brand’s odds of winning by 2.98.
How should GEO tools measure head-to-head prompts?
Ask every head-to-head question in both orders, repeat each order several times, and count a win only if it holds in both orders. A single-order measurement shifts a brand’s win rate by 4.7 percentage points on average, and in about one in six matchups the two orders named different majority winners.
Does brand awareness affect AI recommendations?
Likely, through two routes. Well-known brands already win recommendations directly when specifications are identical. And if buyers name the brand that comes to mind first, the position effect gives better-known brands an extra edge in close comparisons. The naming-order link is a hypothesis the study did not measure.
Which AI model was tested?
gpt-5.6-luna through the OpenAI Responses API with web search enabled and default settings, between October 8 and October 16, 2026. Other models may show weaker, stronger or reversed effects.
Where to go from here
Most AI visibility reports still test head-to-head prompts in one order and treat the result as brand strength. In close matchups, that result is partly an artifact of how the question was typed. Before you act on a “we lose to Competitor X in ChatGPT” finding, check whether it survives the swap.
If you want an outside read on how your brand actually shows up in AI answers, measured in both orders, Opascope’s GEO and AEO team can help. Book an intro call with Opascope.
Appendix: prompt template, brand sets and robustness
Prompt template. English version; the German version is a translation with the same structure. In the second prompt of a vote pair, {brand 1} and {brand 2} swap places at both positions.
Brand sets. Brand names are withheld. “Changed” is vote pairs with a changed winner, won by A : won by B.
| ID | Industry | Lang. | Cat. | Matchups | Vote pairs | Changed | A share |
|---|---|---|---|---|---|---|---|
| B01 | Banking technology | DE | 6 | 30 | 149 | 26 : 5 | 84% |
| B02 | GEO agency (Loud & Lexis) | DE | 5 | 24 | 43 | 6 : 4 | 60% |
| B03 | M&A and financing advisory | DE | 3 | 15 | 73 | 30 : 0 | 100% |
| B04 | Marketing analytics | DE | 5 | 25 | 125 | 25 : 5 | 83% |
| B05 | Sales software | DE | 6 | 30 | 150 | 31 : 10 | 76% |
| B06 | Tea and spices | DE | 6 | 30 | 150 | 26 : 8 | 76% |
| B07 | Travel activities | DE | 6 | 30 | 148 | 13 : 7 | 65% |
| B08 | Breathalyzers | EN | 6 | 29 | 145 | 20 : 8 | 71% |
| B09 | Company formation and legal services | EN | 6 | 30 | 150 | 24 : 6 | 80% |
| B10 | Defense technology | EN | 4 | 20 | 100 | 17 : 1 | 94% |
| B11 | Diamond painting kits | EN | 4 | 19 | 95 | 11 : 11 | 50% |
| B12 | Dietary supplements | EN | 3 | 15 | 75 | 7 : 0 | 100% |
| B13 | Electrolyte drinks | EN | 6 | 30 | 150 | 22 : 12 | 65% |
| B14 | Fitness tracking | EN | 1 | 5 | 25 | 3 : 2 | 60% |
| B15 | Government services | EN | 2 | 10 | 30 | 0 : 2 | 0% |
| B16 | Nutrition gummies | EN | 3 | 15 | 75 | 8 : 7 | 53% |
| B17 | Physical therapy equipment | EN | 4 | 20 | 99 | 6 : 4 | 60% |
| B18 | Probiotics | EN | 3 | 15 | 75 | 1 : 0 | 100% |
| B19 | Rental property software | EN | 6 | 30 | 150 | 37 : 15 | 71% |
| B20 | Therapy practice software | EN | 6 | 30 | 150 | 17 : 18 | 49% |
| B21 | Vitamins | EN | 6 | 30 | 147 | 14 : 3 | 82% |
| Total | 97 | 482 | 2,304 | 344 : 128 | 72.9% |
Robustness checks.
| Check | Result |
|---|---|
| Odds ratio, including the excluded brand set | 3.09 |
| Odds ratio, excluding the Loud & Lexis brand set (B02) | 3.02 |
| Odds ratio, German (7 sets) / English (14 sets) prompts | 4.39 / 2.30 |
| Heterogeneity between brand sets (permutation test, 2,000 draws) | p = 0.002 |
| Odds ratio differs by matchup closeness (likelihood-ratio test, 4 df) | p = 0.23 |
| Variation of the share won by A across repetitions / days (χ² test) | p = 0.58 / 0.36 |
| Answers without a verdict (focus brand named first / second) | 3 / 7 |
Data availability. The vote-level data contain client brand names and are not published. Results per brand set are given above.
Competing interests. This study was carried out and published by Loud & Lexis, an agency that sells GEO measurement and optimization services, with Opascope as a co-author. Most brand sets come from Loud & Lexis or Opascope client projects, and one (B02) is Loud & Lexis itself; excluding it barely changes the results. No client funded the study or saw results before publication. No AI provider funded or reviewed the study.
Suggested citation. Henrich, E., Park, J., & Peschke, T. (2026). First come, first recommended? Position bias in head-to-head brand recommendations by a frontier AI model (Whitepaper v1.0). Loud & Lexis.
References
- Aaker, D. A. (1996). Building strong brands. The Free Press.
- Agresti, A. (2013). Categorical data analysis (3rd ed.). Wiley.
- Allouah, A., Besbes, O., Figueroa, J. D., Kanoria, Y., & Kumar, A. (2025). What is your AI agent buying? Evaluation, biases, model dependence, & emerging implications for agentic e-commerce. Preprint, arXiv:2508.02630v3. https://arxiv.org/abs/2508.02630v3
- Bito, E., Ren, Y., & He, E. (2025). Evaluating position bias in large language model recommendations. Preprint, arXiv:2508.02020. https://arxiv.org/abs/2508.02020
- Bradley, R. A., & Terry, M. E. (1952). Rank analysis of incomplete block designs: I. The method of paired comparisons. Biometrika, 39(3/4), 324–345. https://doi.org/10.2307/2334029
- Brucks, M., & Toubia, O. (2025). Prompt architecture induces methodological artifacts in large language models. PLOS ONE, 20(4), e0319159. https://doi.org/10.1371/journal.pone.0319159
- Cameron, A. C., Gelbach, J. B., & Miller, D. L. (2008). Bootstrap-based improvements for inference with clustered errors. The Review of Economics and Statistics, 90(3), 414–427. https://doi.org/10.1162/rest.90.3.414
- Chu, X., & Hou, Y. (2026). Incumbent advantage: Brand bias and cognitive manipulation dynamics in LLM recommendation systems. Preprint, arXiv:2606.17443. https://arxiv.org/abs/2606.17443
- Clopper, C. J., & Pearson, E. S. (1934). The use of confidence or fiducial limits illustrated in the case of the binomial. Biometrika, 26(4), 404–413. https://doi.org/10.1093/biomet/26.4.404
- Hou, Y., Zhang, J., Lin, Z., Lu, H., Xie, R., McAuley, J., & Zhao, W. X. (2024). Large language models are zero-shot rankers for recommender systems. In Advances in Information Retrieval (ECIR 2024) (pp. 364–381). Springer. https://arxiv.org/abs/2305.08845
- Keller, K. L. (1993). Conceptualizing, measuring, and managing customer-based brand equity. Journal of Marketing, 57(1), 1–22. https://doi.org/10.1177/002224299305700101
- Laurito, W., Davis, B., Grietzer, P., Gavenčiak, T., Böhm, A., & Kulveit, J. (2025). AI–AI bias: Large language models favor communications generated by large language models. Proceedings of the National Academy of Sciences, 122(31), e2415697122. https://doi.org/10.1073/pnas.2415697122
- Mantel, N., & Haenszel, W. (1959). Statistical aspects of the analysis of data from retrospective studies of disease. Journal of the National Cancer Institute, 22(4), 719–748. https://doi.org/10.1093/jnci/22.4.719
- Mantonakis, A., Rodero, P., Lesschaeve, I., & Hastie, R. (2009). Order in choice: Effects of serial position on preferences. Psychological Science, 20(11), 1309–1312. https://doi.org/10.1111/j.1467-9280.2009.02453.x
- McNemar, Q. (1947). Note on the sampling error of the difference between correlated proportions or percentages. Psychometrika, 12(2), 153–157. https://doi.org/10.1007/BF02295996
- Miller, J. M., & Krosnick, J. A. (1998). The impact of candidate name order on election outcomes. Public Opinion Quarterly, 62(3), 291–330. https://doi.org/10.1086/297848
- Pezeshkpour, P., & Hruschka, E. (2024). Large language models sensitivity to the order of options in multiple-choice questions. In Findings of the Association for Computational Linguistics: NAACL 2024 (pp. 2006–2017). https://doi.org/10.18653/v1/2024.findings-naacl.130
- Shi, L., Ma, C., Liang, W., Diao, X., Ma, W., & Vosoughi, S. (2025). Judging the judges: A systematic study of position bias in LLM-as-a-judge. In Proceedings of IJCNLP-AACL 2025 (Volume 1: Long Papers) (pp. 292–314). https://doi.org/10.18653/v1/2025.ijcnlp-long.18
- Wang, P., Li, L., Chen, L., Cai, Z., Zhu, D., Lin, B., Cao, Y., Kong, L., Liu, Q., Liu, T., & Sui, Z. (2024). Large language models are not fair evaluators. In Proceedings of the 62nd Annual Meeting of the Association for Computational Linguistics (Volume 1: Long Papers) (pp. 9440–9450). https://doi.org/10.18653/v1/2024.acl-long.511
- Wang, Y., Cai, Y., Chen, M., Liang, Y., & Hooi, B. (2023). Primacy effect of ChatGPT. In Proceedings of the 2023 Conference on Empirical Methods in Natural Language Processing (pp. 108–115). https://doi.org/10.18653/v1/2023.emnlp-main.8
- Zheng, C., Zhou, H., Meng, F., Zhou, J., & Huang, M. (2024). Large language models are not robust multiple choice selectors. In The Twelfth International Conference on Learning Representations (ICLR 2024). https://openreview.net/forum?id=shr9PXz7T0
- Zheng, L., Chiang, W.-L., Sheng, Y., Zhuang, S., Wu, Z., Zhuang, Y., Lin, Z., Li, Z., Li, D., Xing, E. P., Zhang, H., Gonzalez, J. E., & Stoica, I. (2023). Judging LLM-as-a-judge with MT-Bench and Chatbot Arena. In Advances in Neural Information Processing Systems 36 (Datasets and Benchmarks Track). https://arxiv.org/abs/2306.05685